Processes List
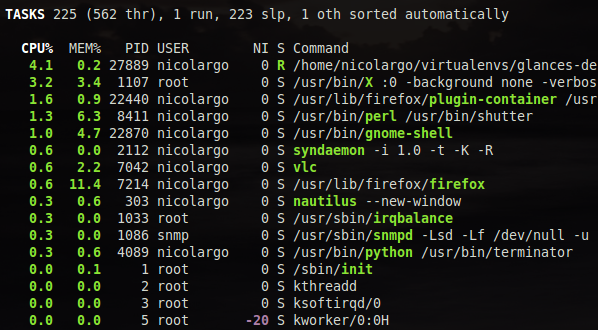
Compact view:
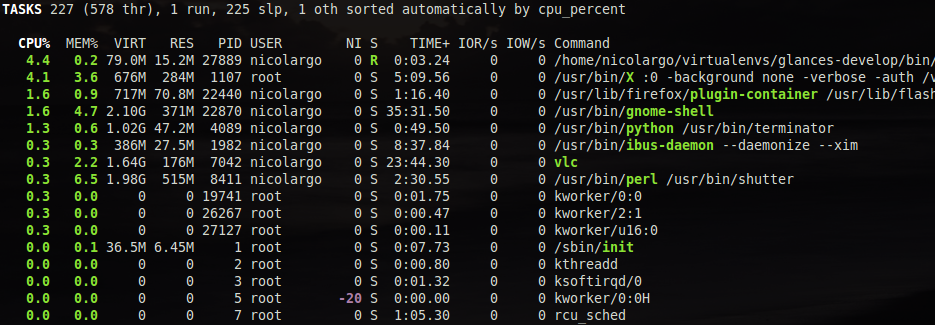
Full view:
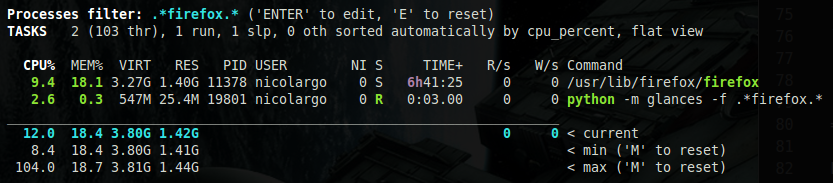
Filtered view:
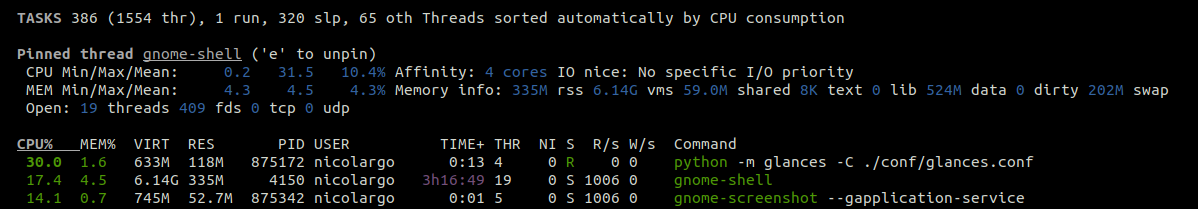
Extended view:
The process view consists of 3 parts:
Processes summary
Monitored processes list (optional, only in standalone mode)
Extended stats for the selected process (optional)
Processes list
The processes summary line displays:
Total number of tasks/processes (aliases as total in the Glances API)
Number of threads
Number of running tasks/processes
Number of sleeping tasks/processes
Other number of tasks/processes (not in running or sleeping states)
Sort key for the process list
By default, or if you hit the a key, the processes list is
automatically sorted by:
CPU: if there is no alert (default behavior)CPU: if a CPU or LOAD alert is detectedMEM: if a memory alert is detectedDISK I/O: if a CPU iowait alert is detected
You can also set the sort key in the UI:
by clicking on left and right arrows
by clicking on the following shortcuts or command line option:
Shortcut |
Command line option |
Description |
|---|---|---|
a |
Automatic sort |
Default sort |
c |
–sort-processes cpu_percent |
Sort by CPU |
e |
N/A |
Pin the process and display extended stats |
i |
–sort-processes io_counters |
Sort by DISK I/O |
j |
–programs |
Accumulate processes by program (extended stats disable in this mode) |
m |
–sort-processes memory_percent |
Sort by MEM |
p |
–sort-processes name |
Sort by process name |
t |
–sort-processes cpu_times |
Sort by CPU times |
u |
–sort-processes username |
Sort by process username |
The number of processes in the list is adapted to the screen size.
Columns display
|
% of CPU used by the process If Irix/Solaris mode is off (‘0’ key), the value is divided by logical core number (the column name became CPUi) |
|
% of MEM used by the process (RES divided by the total RAM you have) |
|
Virtual Memory Size The total amount of virtual memory used by the process. It includes all code, data and shared libraries plus pages that have been swapped out and pages that have been mapped but not used. Virtual memory is usually much larger than physical memory, making it possible to run programs for which the total code plus data size is greater than the amount of RAM available. Most of the time, this is not a useful number. |
|
Resident Memory Size The non-swapped physical memory a process is using (what’s currently in the physical memory). |
|
Process ID (column is replaced by NPROCS in accumulated mode) |
|
Number of process + childs (only in accumulated mode) |
|
User ID |
|
Threads number of the process |
|
Cumulative CPU time used by the process |
|
Nice level of the process |
|
Process status The status of the process:
|
|
Per process I/O read rate in B/s |
|
Per process I/O write rate in B/s |
|
CPU core number where the process is currently running Displays the 0-based CPU core number (0, 1, 2, etc.) where the process is executing. The value updates dynamically as processes migrate between CPU cores. Shows Available on Linux, FreeBSD, and SunOS only. Automatically disabled on Windows and macOS. Can be disabled via configuration with:
|
|
Process command line or command name User can switch to the process name by
pressing on the |
Disable display of virtual memory
It’s possible to disable the display of the VIRT column (virtual memory) by adding the
disable_virtual_memory=True option in the [processlist] section of the configuration
file (glances.conf):
[processlist]
disable_virtual_memory=True
Process filtering
It’s possible to filter the processes list using the ENTER key.
Glances filter syntax is the following (examples):
python: Filter processes name or command line starting with python (regexp).*python.*: Filter processes name or command line containing python (regexp)username:nicolargo: Processes of nicolargo user (key:regexp)cmdline:\/usr\/bin.*: Processes starting by /usr/bin
Process focus
It’s also possible to select a processes list to focus on.
A list of Glances filters (see upper) can be define from the command line:
glances --process-focus .*python.*,.*firefox.*
or the glances.conf file:
[processlist]
focus=.*python.*,.*firefox.*
Extended info
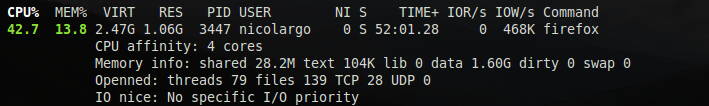
In standalone mode, additional information are provided for the top process:
|
Number of cores used by the process |
|
Extended memory information about the process For example, on Linux: swap, shared, text, and data |
|
The number of threads, files and network sessions (TCP and UDP) used by the process |
|
The process I/O niceness (priority) |
The extended stats feature can be enabled using the
--enable-process-extended option (command line) or the e key
(curses interface).
In curses/standalone mode, you can select a process using UP and DOWN and press:
- k to kill the selected process
Note
Limit for CPU and MEM percent values can be overwritten in the
configuration file under the [processlist] section. It is also
possible to define limit for Nice values (comma-separated list).
For example: nice_warning=-20,-19,-18
Accumulated per program — key ‘j’
When activated (‘j’ hotkey or –programs option in the command line), processes are merged to display which programs are active. The columns show the accumulated cpu consumption, the accumulated virtual and resident memory consumption, the accumulated transferred data I/O. The PID columns is replaced by a NPROCS column which is the number of processes.
Export process
Glances version 4 introduces a new feature to export specifics processes. In order to use this feature, you need to use the export option in the processlist section of the Glances configuration file or the –export-process-filter option in the command line.
The export option is a list of Glances filters.
Example number one, export all processes named ‘python’ (or with a command line containing ‘python’):
[processlist]
export=.*python.*
Note: or the –export-process-filter “.*python.*” option in the command line.
Example number two, export all processes with the name ‘python’ or ‘bash’:
[processlist]
export=.*python.*,.*bash.*
Note: or the –export-process-filter “.*python.*,.*bash.*” option in the command line.
Example number three, export all processes belong to ‘nicolargo’ user:
[processlist]
export=username:nicolargo
Note: or the –export-process-filter “username:nicolargo” option in the command line.
The output of the export use the PID as the key (for example if you want to export firefox process to a CSV file):
Configuration file (glances.conf):
[processlist]
export=.*firefox.*
Note: or the –export-process-filter “.*firefox.*” option in the command line.
Command line example:
glances -C ./conf/glances.conf --export csv --export-csv-file /tmp/glances.csv --disable-plugin all --enable-plugin processlist --quiet
the result will be:
timestamp,845992.memory_percent,845992.status,845992.num_threads,845992.cpu_timesuser,845992.cpu_timessystem,845992.cpu_timeschildren_user,845992.cpu_timeschildren_system,845992.cpu_timesiowait,845992.memory_inforss,845992.memory_infovms,845992.memory_infoshared,845992.memory_infotext,845992.memory_infolib,845992.memory_infodata,845992.memory_infodirty,845992.name,845992.io_counters,845992.nice,845992.cpu_percent,845992.pid,845992.gidsreal,845992.gidseffective,845992.gidssaved,845992.key,845992.time_since_update,845992.cmdline,845992.username,total,running,sleeping,thread,pid_max
2024-04-03 18:39:55,3.692938041968513,S,138,1702.88,567.89,1752.79,244.18,0.0,288919552,12871561216,95182848,856064,0,984535040,0,firefox,1863281664,0,0.5,845992,1000,1000,1000,pid,2.2084147930145264,/snap/firefox/3836/usr/lib/firefox/firefox,nicolargo,403,1,333,1511,0
2024-04-03 18:39:57,3.692938041968513,S,138,1702.88,567.89,1752.79,244.18,0.0,288919552,12871561216,95182848,856064,0,984535040,0,firefox,1863281664,0,0.5,845992,1000,1000,1000,pid,2.2084147930145264,/snap/firefox/3836/usr/lib/firefox/firefox,nicolargo,403,1,333,1511,0