GPU
For the moment, following GPU are supported: - NVidia (thanks to the nvidia-ml-py library) - NVidia Jetson / Tegra integrated GPU (NVML reports the device but not its
telemetry, so usage and temperature are read from Tegra sysfs)
AMD (only on Linux Operating system with kernel 5.14 or higher)
Intel (only on Linux Operating system)
ARM (only on Linux Operating system with kernel 6.0 or higher; drivers: msm/Adreno, Panfrost, Panthor, v3d, Lima, Etnaviv)
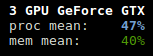
The GPU stats are shown as a percentage of value and for the configured refresh time. It displays:
GPU usage (NVidia, AMD and ARM) or frequency (Intel)
memory consumption (NVidia, AMD, and ARM when exposed by fdinfo)
temperature (if available)
Note
For panthor and panfrost, per-engine sampling
(drm-engine-* and drm-cycles-* fdinfo counters) is disabled
by default to save power. Enable it via sysfs:
echo 1 > /sys/bus/platform/drivers/panthor/*.gpu/profiling
echo 1 > /sys/bus/platform/drivers/panfrost/*.gpu/profiling
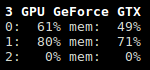
If you click on the 6 short key, the per-GPU view is displayed:
Note
You can also start Glances with the --meangpu option to display
the first view by default.
You can change the threshold limits in the configuration file:
[gpu]
# Default processor values if not defined: 50/70/90
proc_careful=50
proc_warning=70
proc_critical=90
# Default memory values if not defined: 50/70/90
mem_careful=50
mem_warning=70
mem_critical=90
# Temperature
temperature_careful=60
temperature_warning=70
temperature_critical=80
Legend:
GPU (PROC/MEM) |
Status |
|---|---|
|
|
|
|
|
|
|
|