CPU
The CPU stats are shown as a percentage or values and for the configured refresh time.
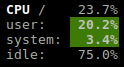
The total CPU usage is displayed on the first line.
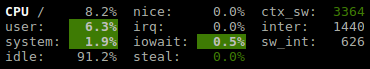
If enough horizontal space is available, extended CPU information are displayed.
CPU stats description:
total: sum of all CPU percentages (except idle).
total_min: minimum total observed since Glances startup.
total_max: maximum total observed since Glances startup.
total_mean: mean (average) total computed from the history.
user: percent time spent in user space. User CPU time is the time spent on the processor running your program’s code (or code in libraries).
system: percent time spent in kernel space. System CPU time is the time spent running code in the Operating System kernel.
idle: percent of CPU used by any program. Every program or task that runs on a computer system occupies a certain amount of processing time on the CPU. If the CPU has completed all tasks it is idle.
nice (*nix): percent time occupied by user level processes with a positive nice value. The time the CPU has spent running users’ processes that have been niced.
irq (Linux, *BSD): percent time spent servicing/handling hardware/software interrupts. Time servicing interrupts (hardware + software).
iowait (Linux): percent time spent by the CPU waiting for I/O operations to complete.
steal (Linux): percentage of time a virtual CPU waits for a real CPU while the hypervisor is servicing another virtual processor.
guest (Linux): percentage of time a virtual CPU spends servicing another virtual CPU under the control of the Linux kernel.
ctx_sw: number of context switches (voluntary + involuntary) per second. A context switch is a procedure that a computer’s CPU (central processing unit) follows to change from one task (or process) to another while ensuring that the tasks do not conflict.
inter: number of interrupts per second.
sw_inter: number of software interrupts per second. Always set to 0 on Windows and SunOS.
syscal: number of system calls per second. Do not displayed on Linux (always 0).
dpc: (Windows): time spent servicing deferred procedure calls.
To switch to per-CPU stats, just hit the 1 key:
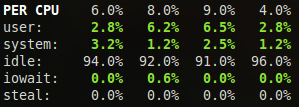
In this case, Glances will show on line per logical CPU on the system. If you have multiple core, it is possible to define the maximum number of CPU to display. The top ‘max_cpu_display’ will be display and an extra line with the mean of all others CPU will be added.
[percpu]
# Define the maximum number of CPU display at a time
# If the number of CPU is higher than:
# - display the top 'max_cpu_display' (sorted by CPU consumption)
# - a last line will be added with the sum of all other CPUs
max_cpu_display=4
Logical cores means the number of physical cores multiplied by the number of threads that can run on each core (this is known as Hyper Threading).
By default, steal CPU time alerts aren’t logged. If you want that,
just add to the configuration file:
[cpu]
steal_log=True
Legend:
CPU (user/system) |
Status |
|---|---|
|
|
|
|
|
|
|
|
Note
Limit values can be overwritten in the configuration file under
the [cpu] and/or [percpu] sections.